WEEKLY RECAP
- U.S. jobs surge: June added 147,000 jobs (beat forecasts), unemployment fell to 4.1% despite weak private payrolls.
- U.S. stocks hit records: S&P 500 & Nasdaq closed at all-time highs for second straight week.
- U.S.-Vietnam trade deal: Trump secured agreement days before July 9 tariff deadline.
- ECB inflation caution: Eurozone hit 2% inflation target, but Lagarde signaled delayed rate cuts.
- Japan-U.S. tariff risk: Trade talks stalled, risking 24-35% tariffs if no deal by July 9.
WEEKLY AHEAD
- July 8, 2025, China National Bureau of Statistics, Consumer Price Index (CPI) (June)
- July 8, 2025, China National Bureau of Statistics, Producer Price Index (PPI) (June)
- July 9, 2025, USA Bureau of Labor Statistics, Consumer Price Index (CPI) (June)
- July 10, 2025, USA Bureau of Labor Statistics, Producer Price Index (PPI) (June)
- July 11, 2025, USA Bureau of Labor Statistics, Initial Jobless Claims (Weekly)
MAJOR MARKETS
Name
Dow Jones
S&P 500
Nasdaq
Nikkei 225
HSI
SHI
Last Close
44,828.53
6,279.35
20,601.10
39,810.88
23,916.06
3,472.32
7D%
2.30%
1.72%
1.62%
-0.85%
-1.52%
1.40%
THOUGHTS OF THE WEEK
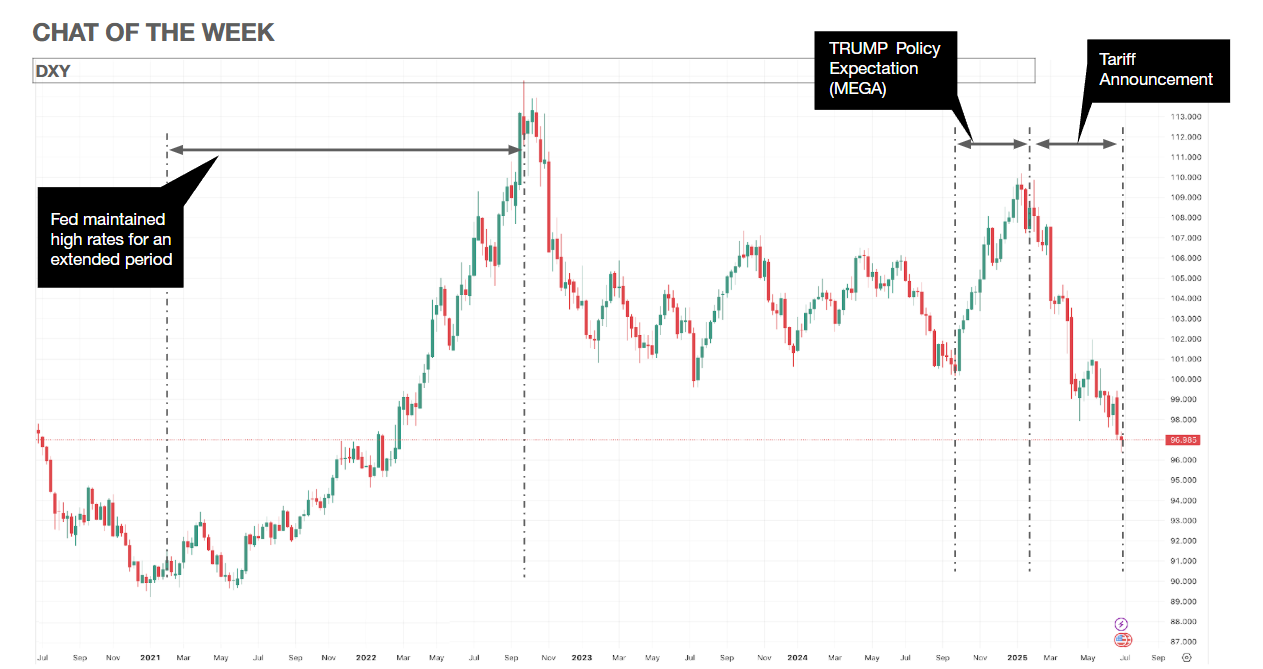
Despite a swift rebound in U.S. equities and bond markets following early-2025 volatility triggered by Trump tariff policies, the U.S. dollar has continued its descent. The dollar index (DXY) has plummeted 10% since January 2025, hitting lows not seen since 2022. This divergence presents a critical puzzle: Why has the world’s reserve currency failed to recover alongside other dollar-denominated assets? Understanding this anomaly requires examining structural dollar dynamics, policy impacts, and global confidence shifts.

I. Historical Context & Dollar Fundamentals
The DXY Framework and Structural Drivers
The dollar index measures USD strength against six major currencies (EUR 57.5%, JPY 13.6%, GBP 11.9%, CAD 9.1%, SEK 4.2%, CHF 3.6%). Post-1999, it has experienced five distinct phases:
Period
1999-2001
2002-2008
2008-2014
2015-2020
2021-2024
Driver
Dot-com boom
Emerging markets rise
Safe-haven demand during GFC
Fed tightening cycle
Post-pandemic hawkish policy
DXY Trend
↑
↓
→
↑
↑
Supply-Demand Dynamics:
- Supply Pressures: Chronic trade deficits ($886B in 2024), Fed easing, and fiscal deficits (projected 6.2% of GDP in 2025)
- Demand Drivers: Global trade settlement (75% USD-denominated), central bank reserves (59% USD share), and dollar asset inflows
II. The 2025 Decline: Triggers and Amplifiers
Trump Policy Uncertainty and Confidence Erosion
The dollar’s 10% surge (Sep 2024-Jan 2025) on “America Great Again” optimism reversed sharply due to:
- Tariff Shocks: 10-25% levies on $300B imports triggering trade retaliation
- Fiscal Expansion: Tax cuts + defense spending widening deficits to $1.9T
- Institutional Erosion: Goldman Sachs reports 17% drop in foreign Treasury holdings YTD
“Trump’s policies transformed dollar strength from an economic phenomenon to a confidence crisis,” notes former Fed economist David Wilcox. The DXY slide accelerated as sovereign funds from BRICS nations reduced dollar allocations by 3.2% in Q1 2025.
III. Future Outlook: Pressures vs. Pillars
Why Dollar Hegemony Endures (For Now)
Bearish Forces:
- Political uncertainty (2025 Policy Uncertainty Index at 210 vs. 150 avg)
- Accelerating dedollarization (38 bilateral non-USD trade pacts since 2023)
- Fed-Biden policy divergence
- Bullish Anchors:
Growth
Policy Rate
2025 Easing
U.S.
2.4% (Q2)
4.5%
50bps
Eurozone
0.7% (Q2)
2.0%
150bps
Key Stabilizers:
- Treasury Secretary Betsant’s strong-dollar advocacy blocking radical proposals
- AI-driven capital inflows ($128B into U.S. tech Q2 2025)
- Lack of viable alternatives (Eurozone fragmentation risk, yuan inconvertibility)
IV. Global Realignment: Challengers to Dollar Hegemony
Euro’s Opportunistic Resilience
Despite ECB rate cuts (deposit rate at 2.0%), the EUR gained against USD due to:
- Upwardly revised 1.0% 2025 Eurozone growth
- €750B recovery fund and German corporate subsidies
- Relative policy stability vs. U.S. turbulence
RMB’s Limited Ascendancy
China counters tariffs via:
- Domestic stimulus: SME subsidies and export quotas
- Currency management: Allowing CNY depreciation to offset tariffs (as in 2018-19, when it fell 10%).
However, capital controls and dumping fears constrain RMB internationalization.
De-Dollarization Momentum
- Bilateral Settlements: BRICS promoting local currency trade
- Diversification: 46 central banks actively reducing USD reserves
- Structural Hurdles: No credible alternative; USD still backs ~60% of global trade
CHART OF THE WEEK
V Outlook and Strategic Implications
Scenario Analysis for H2 2025–2026
Scenario
Bullish USD
Bearish USD
Baseline
Triggers
Tariff pause (Jul 9); >250k NFP; geopolitical crisis
Fed September cut + tariff renewal; growth <1%
Gradual cuts; contained inflation
DXY Range
100–103
<95
96–99
Long-Term Structural Shifts
- Rate Convergence: Fed funds likely falling to 3.4% by 2027 vs. ECB’s floor of ~2%
- Debt Sustainability: U.S. interest expenses may hit 20% of revenues by 2026
- Tech Leadership: AI dominance (e.g., U.S. chip controls) could attract capital inflows
Investor Strategies
- Defensive: Gold + Nordic currencies (low volatility)
- Tactical: Short USD rebounds in 96–100 DXY range
- Long-Term: U.S. AI equities (tech moat) and EM Local Currency Debt (yield advantage)
DISCLAIMER
Chart of The Week: Sources: Bloomberg, Coindesk, Cointelegraph, Forbes, Rados.io, Linux Research
Market Cap & Trading Vol.: Sources: Coinmarketcap, Linux Research
Thought of The Week: Sources: AON, Bloomberg, Blockchain.com, CCN, Coindesk, Cointelegraph, Ethereum World News, Gemini, Insurance Journal, Los Angeles & San Francisco Daily Journal, Linux Research
Week Ahead: Sources: FxStreet.com, Linux Research
Weekly Recap: Sources: FxStreet.com, Linux Research
Past performance does not guarantee future results.
Opinions and estimates offered constitute our judgment and are subject to change without notice, as are statements of financial market trends, which are based on current market conditions. We believe the information provided here is reliable, but do not warrant its accuracy or completeness. This material is not intended as an offer or solicitation for the purchase or sale of any cryptocurrencies. The views and strategies described may not be suitable for all investors. This material has been prepared for informational purposes only, and is not intended to provide, and should not be relied on for, accounting, legal or tax advice. Any forecasts contained herein are for illustrative purposes only and are not to be relied upon as advice or interpreted as a recommendation.
©Linux Group, October 2024.
Unless otherwise stated, all data is as of October 7, 2024 or as of most recently available.